Skip to the content
SecuriTrack HelpcenterSecuriTrack Helpcenter
  • English
    • Français
    • Español
    • Português
  • English
    • Français
    • Español
    • Português

First steps

  • Your vehicles
  • Your drivers
  • Assignment of vehicles
  • Vehicle groups
  • Groups of drivers
  • Management of access rights
  • User management
  • Vehicle display

Geolocation

  • Home page
  • Driver charter
  • The routes
  • Monitoring areas
  • Trailers and dumpsters
  • History of events
  • Fuel level
  • Address book
  • Immobilizing a vehicle
  • Blocking the taximeter
  • Share location

Fleet Management

  • Dashboard
  • Vehicle file
  • Driver record
  • Statistics
  • TCO
  • History
  • Follow-up invoices
  • Follow-up costs
  • Follow-up contracts
  • Follow-up incidents
  • Follow-up of interventions
  • Follow-up of maintenance
  • Follow-up of damages
  • Follow-up of fines
  • Follow-up of vehicle defects
  • Suppliers
  • Definition of costs
  • Definition of VAT
  • Definition of products
  • Definition of the types of maintenance
  • Cards and badges management
  • Fuel station management
  • Allocation centers
  • Vehicle equipment
  • Equipment allocation
  • Driver’s license presentation
  • Multi-fleet manager

Fuel Monitoring

  • Consumption monitoring
  • Heavy trucks

Eco-driving

  • Setting
  • Data analysis
  • Challenges

Temperature Monitoring

  • Temperature management

Consumption monitoring

Table of Contents
  • View a vehicle's fuel and AdBlue levels
  • Tracking of fuel and AdBlue levels for a vehicle over 30 days

View a vehicle’s fuel and AdBlue levels

This option requires the prior installation of an iCAN or Fuel Control sensors for heavy-duty tanks.

The iCAN box retrieves information from the instrument panel.

1. Click on the vehicle icon.

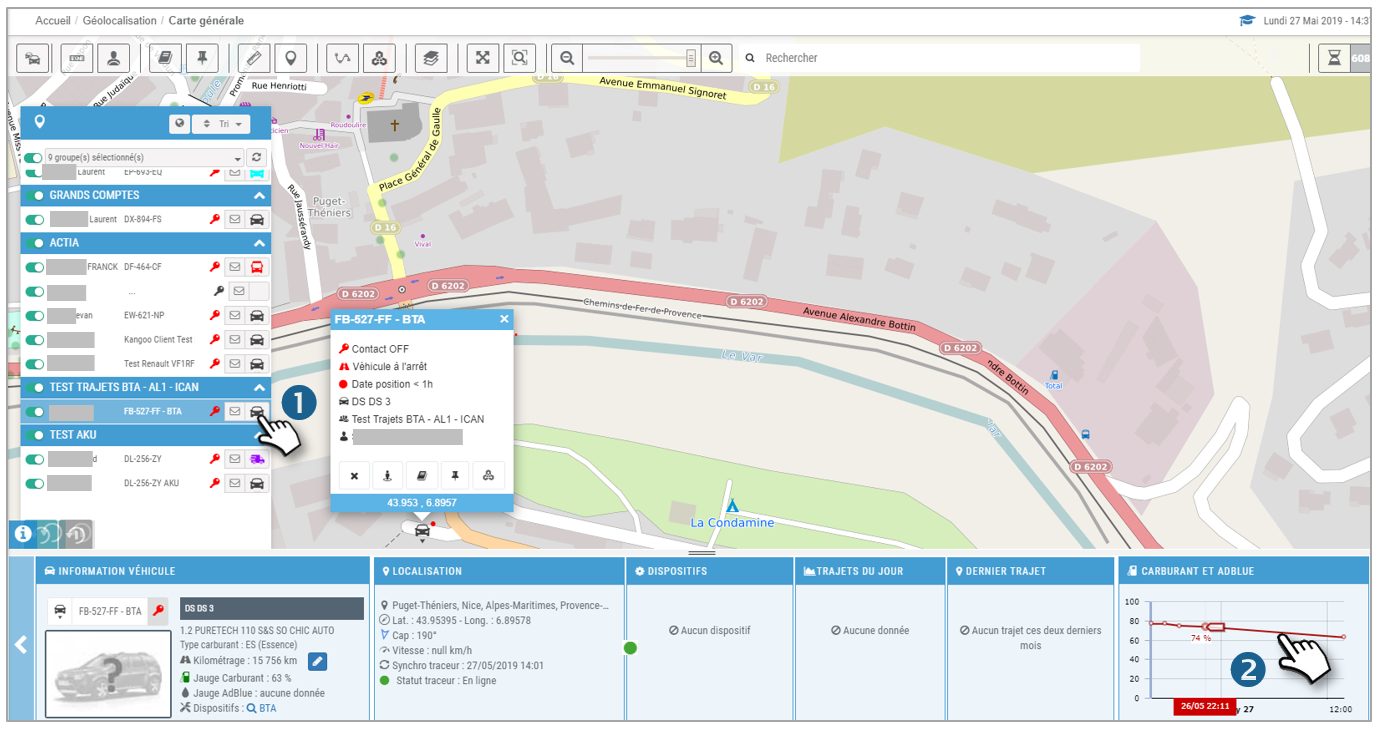
2. In the FUEL AND ADBLUE widget, you see the latest fuel and AdBlue level readings.

3. Click on a sensor to see the latest trips with the fuel (red) and AdBlue (blue) curves. Hover your cursor over a point on the curve to see the level detail and location on the trip.

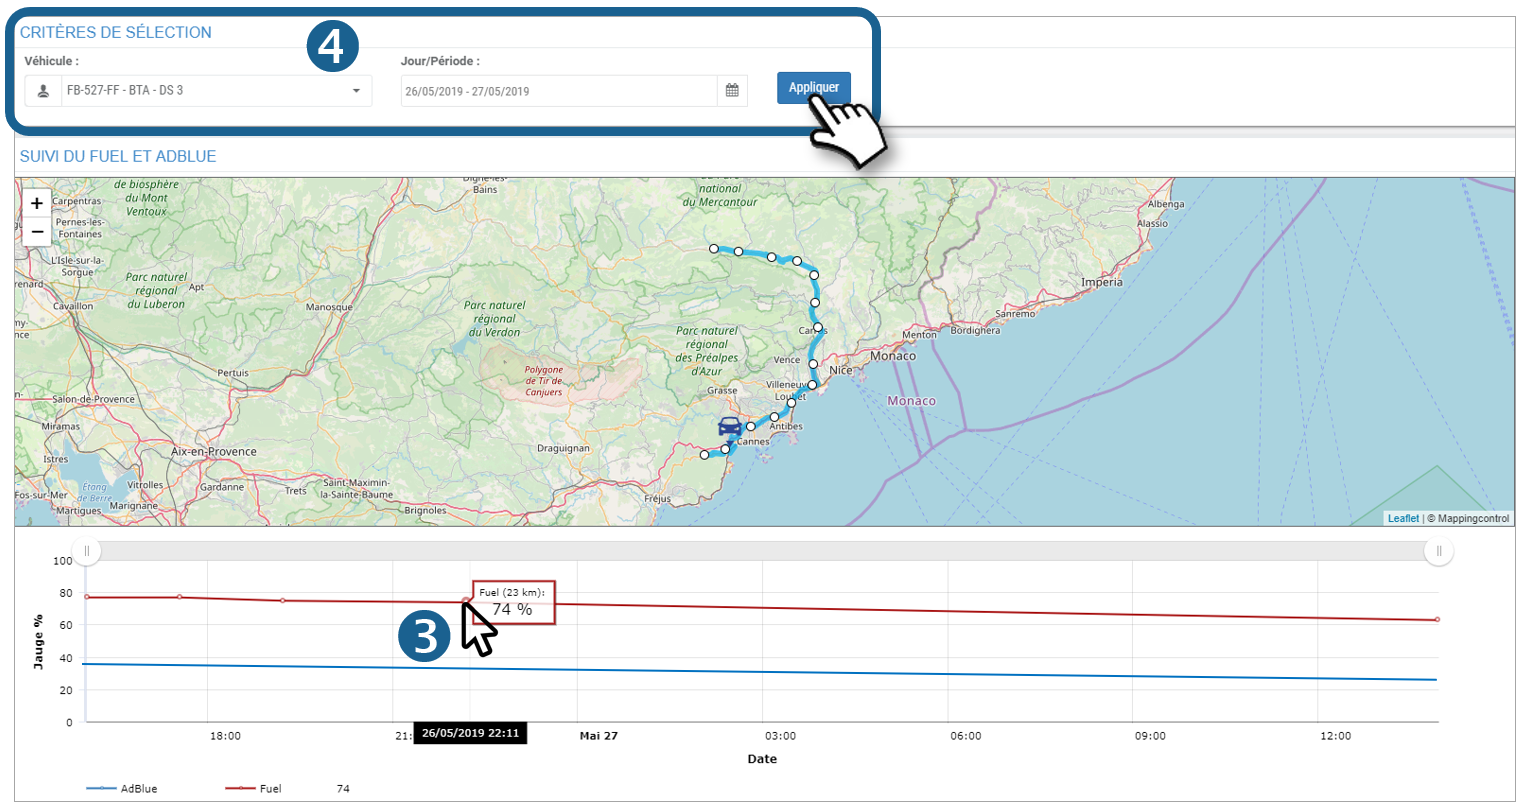
4. You can select another time period or vehicle and view the result.

Tracking of fuel and AdBlue levels for a vehicle over 30 days

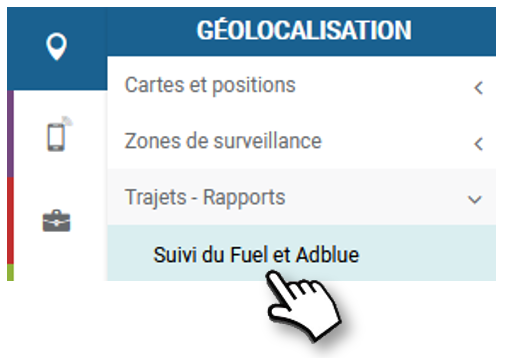
This screen allows you to display, for 1 vehicle, the evolution of its fuel and AdBlue level from 1 to 30 days maximum.

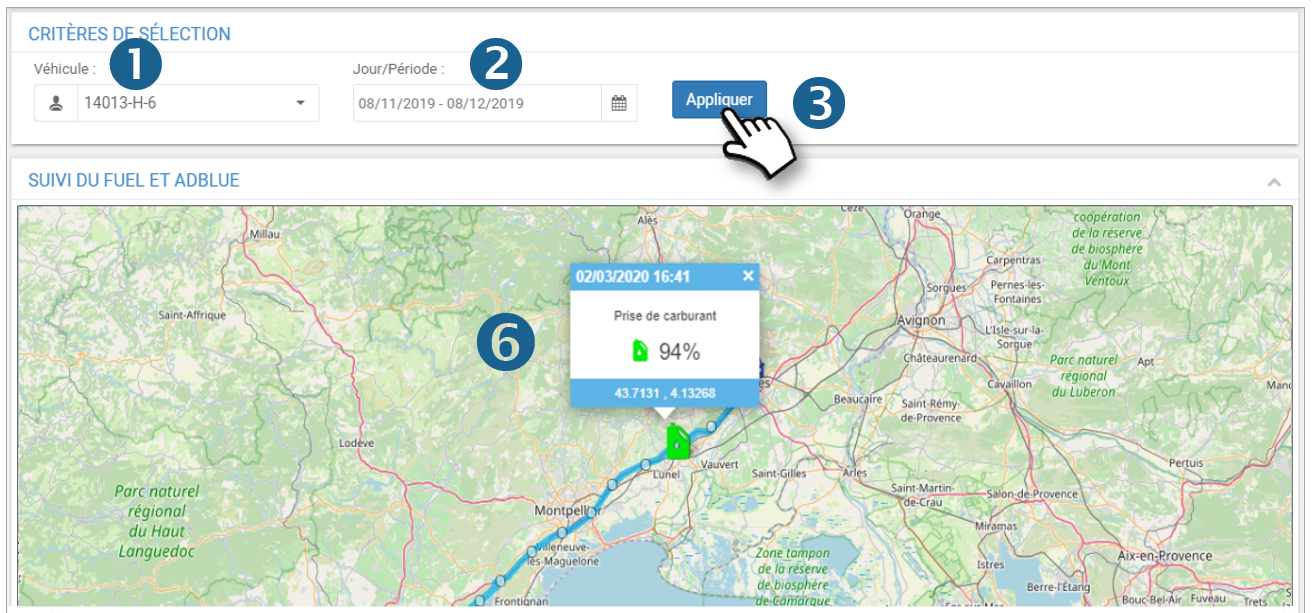
1. Select the vehicle.

2. Select the date or the period concerned (30 days max)

3. Click on APPLY.

4. The trips are displayed on the map with the fuel level rise points and the evolution curve of the fuel and AdBlue levels:

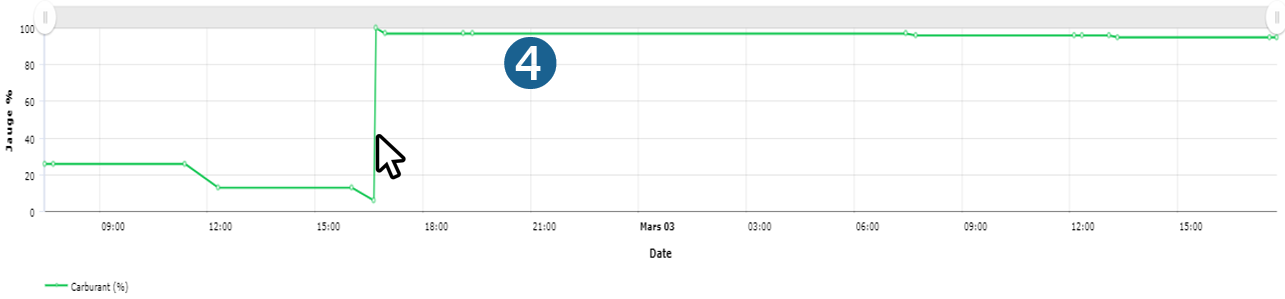
Move the cursor over the graph to see the details of the data and the position on the map.

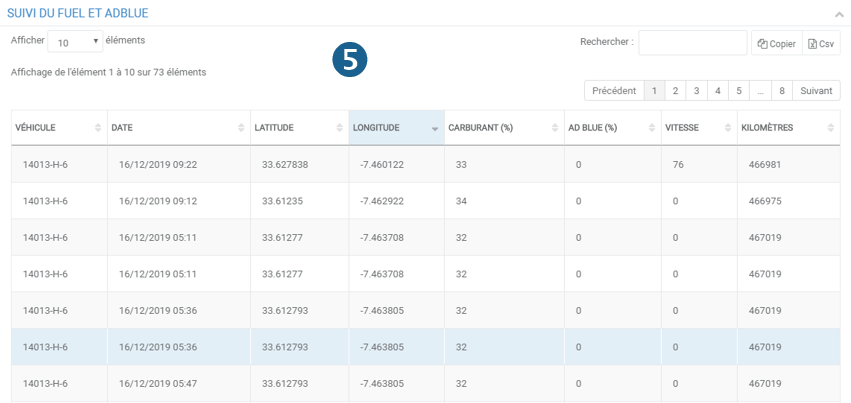
5. The table details the positions and levels:

6. Fuel events are identified on the map by colored icons:

Fuel intake

Low fuel level

Fuel theft (suspected)

Cet article vous a-t-il été utile ?
Updated on 17 March 2022
Heavy trucks
Table of Contents
  • View a vehicle's fuel and AdBlue levels
  • Tracking of fuel and AdBlue levels for a vehicle over 30 days

© 2026 SecuriTrack Helpcenter

Powered by WordPress

To the top ↑ Up ↑