All your performance indicators on your homepage
Your dashboard consists of 4 parts detailed in the following pages:
1. You can filter the display with 1 or more assignment centers. By default, the whole fleet is displayed.
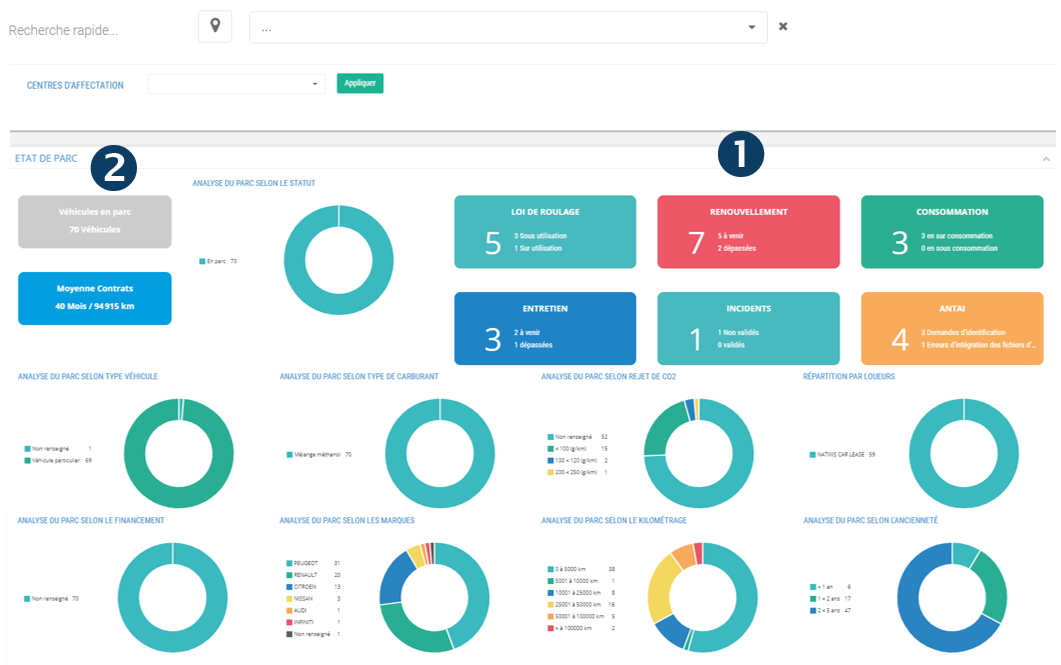
2. I – FLEET STATUS AND ALERTS: statistics on your fleet and 6 clickable indicators that show you the details:
- Rolling law
- Renewal
- Consumption
- Maintenance
- Incidents
- ANTAI (if option subscribed)
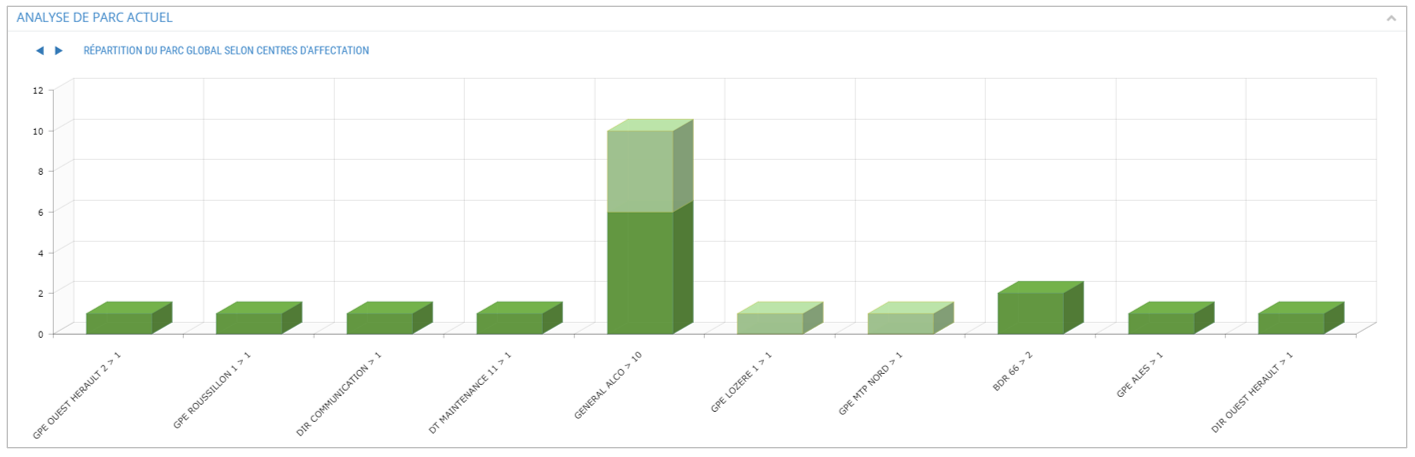
3. II – ANALYSIS OF CURRENT FLEET: distribution of the fleet according to the centers of assignment and the presence or not of a telematics box.
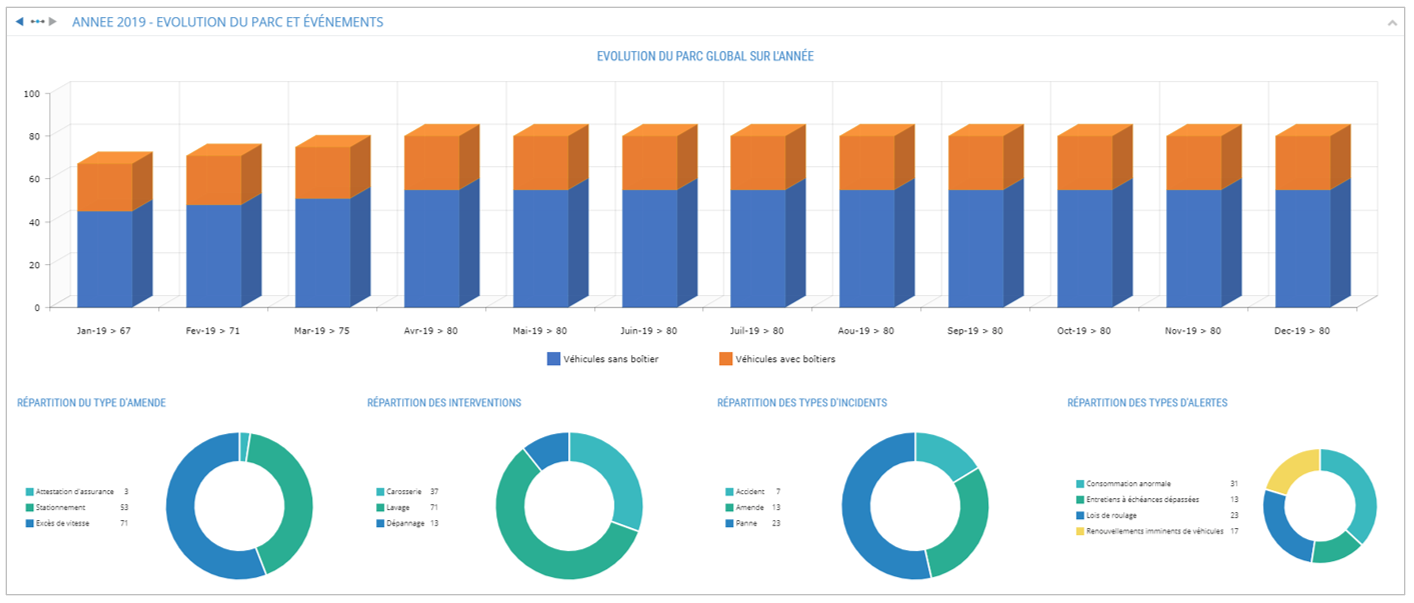
 4. III- EVOLUTION OF THE PARK OVER THE YEAR and BREAKDOWN OF EVENTS: fines, interventions, incidents and alerts.
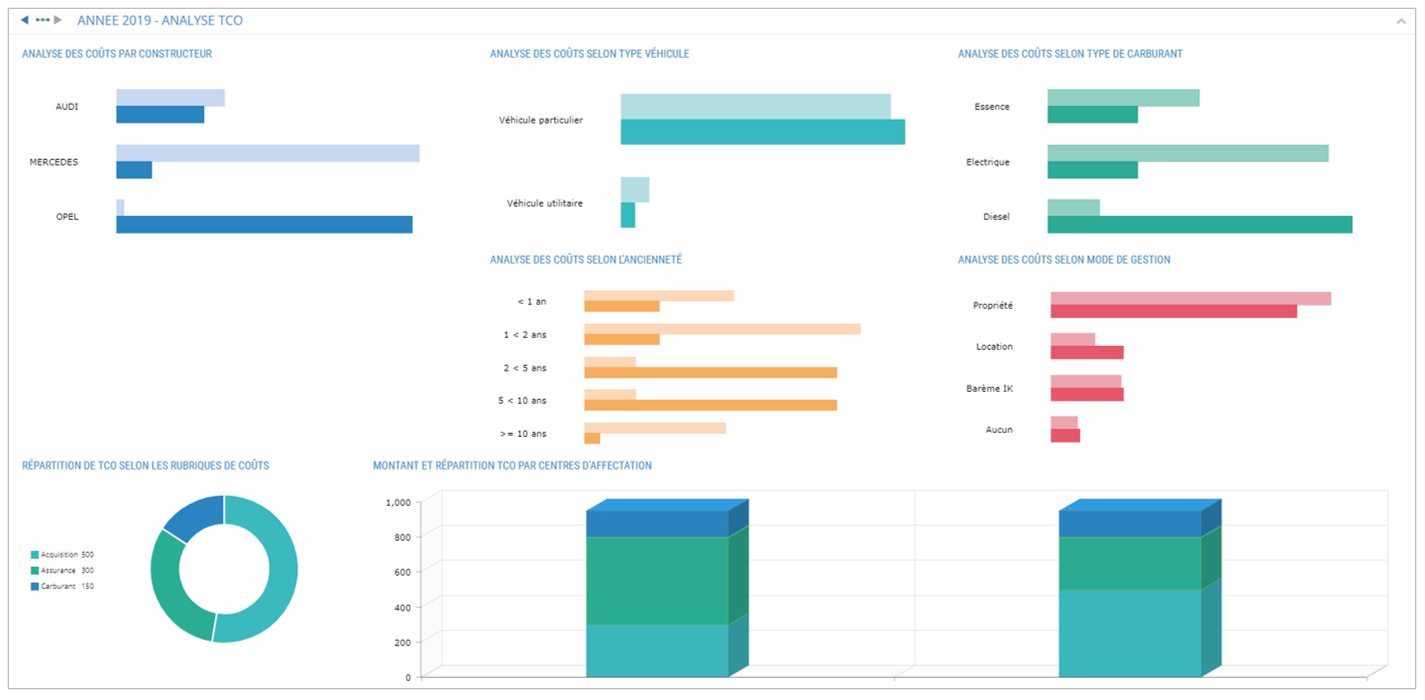
5. IV – ANALYTICAL TCO: weight of the TCO in relation to vehicle criteria (brand, type, age, energy, management method, etc.)
Search and filter bar of the application
6. In the search field located in the banner of the application, you can search for a Driver or a Vehicle by entering the first 3 letters of his name or registration. Click on the driver or the vehicle that is proposed to you in the corresponding list.
The vehicle or driver record will appear on the screen.
7. Once the filter is in place, the Follow-up and Management sub-menus will be filtered on this vehicle or driver.
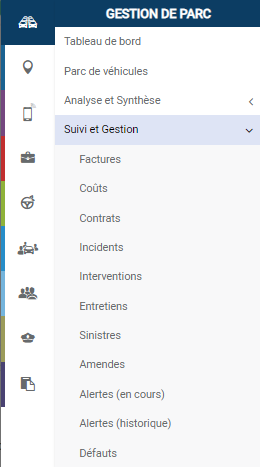
To return to global data, you must remove the filter in the banner.
Statistics on your fleet and alerts that require your intervention
FLEET STATUS:
- Number of vehicles in fleet and their status
- Duration and average km of contracts
ALERTS: 5 events are subject to alerts and notifications in these tiles:
- Rolling law
- Renewal
- Consumption
- Maintenance
- Incidents
Click on the tile to display the page dedicated to the follow-up of this criterion (here INCIDENTS)
FLEET ANALYSIS according to 8 criteria :
- Type of vehicle : PV/CV….
- Type of fuel
- CO2 emission
- Renters
- Financing
- Brand
- Mileage
- Age