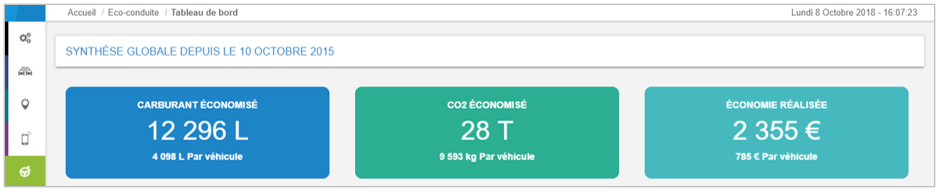
Dashboard
All your data is displayed on a single page
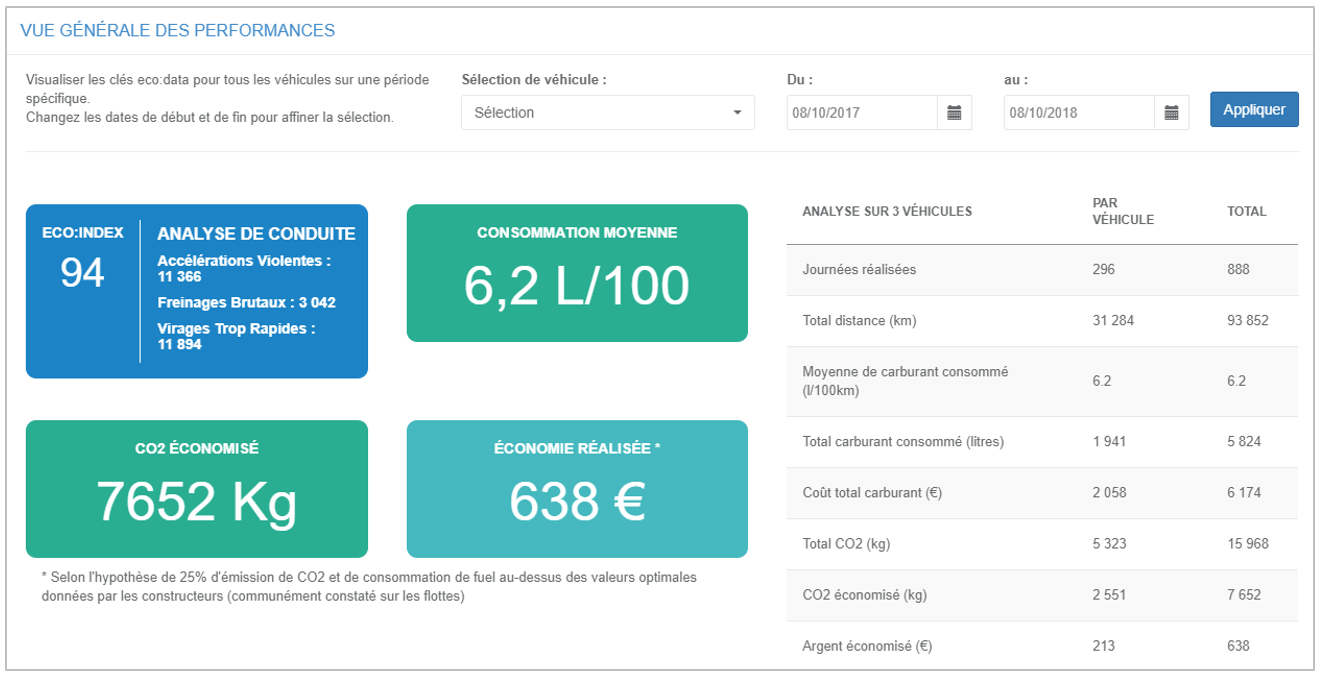
Synthesis: Your gains since the implementation of eco-driving
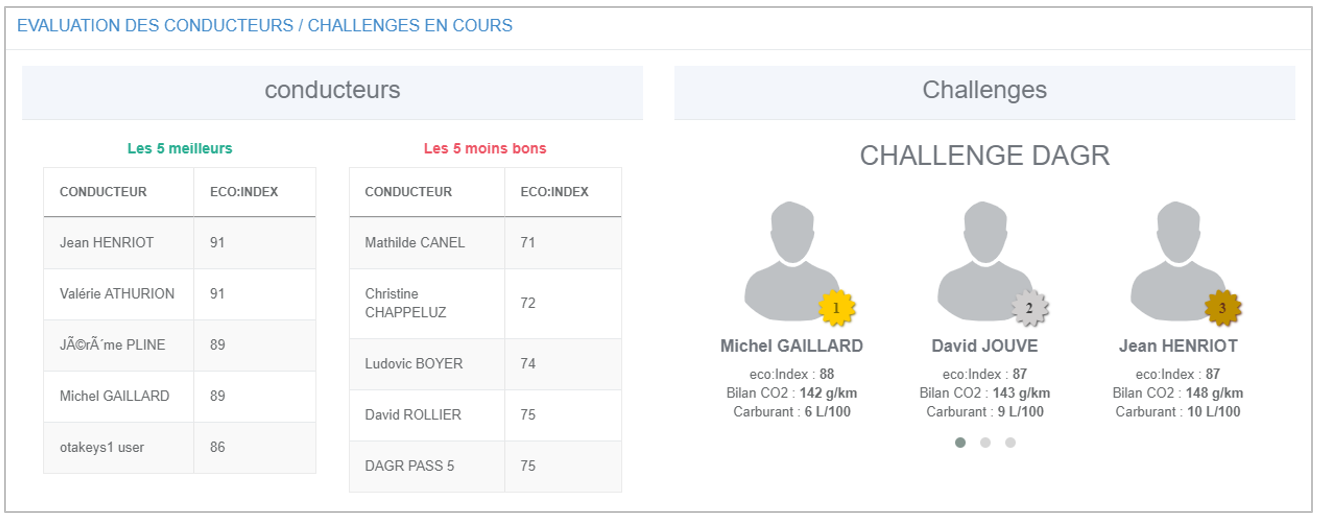
Driver evaluation : The 5 best, the 5 worst, the podiums of the current challenges
Performance overview: Numerous data sortable by drivers and by period
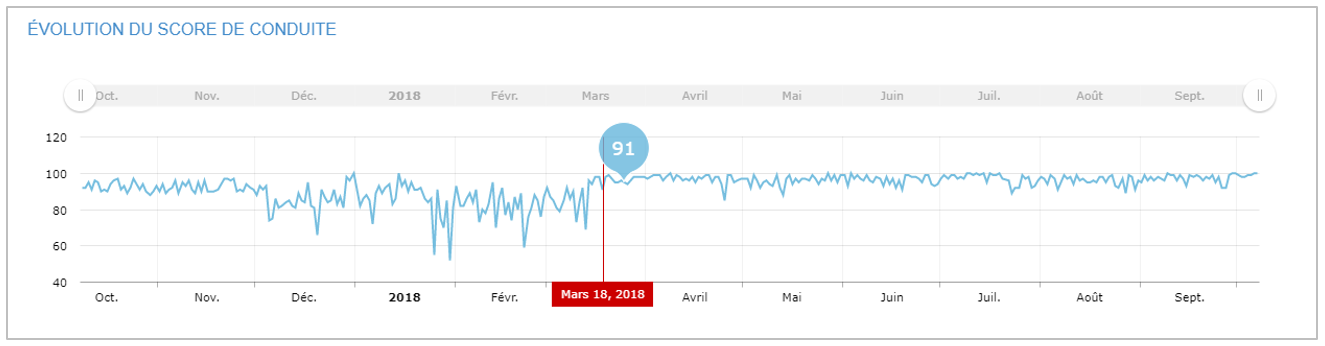
Evolution of the eco-driving score : Applies to all drivers. Zoom in by click-drag-drop.
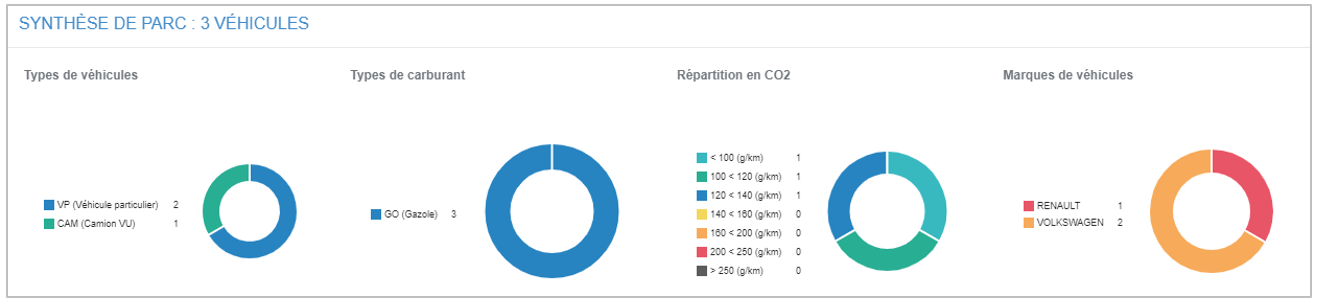
Your vehicle fleet: In 4 graphs: types, fuel type, CO2 class, brands
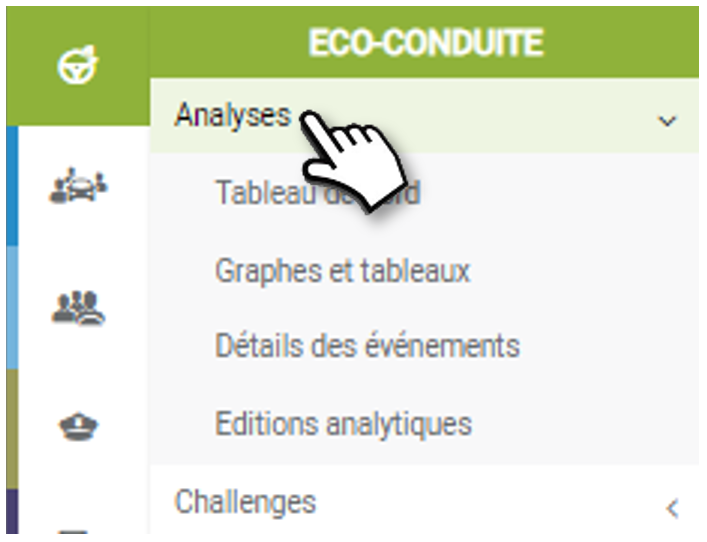
Charts and tables
View the statistics of your drivers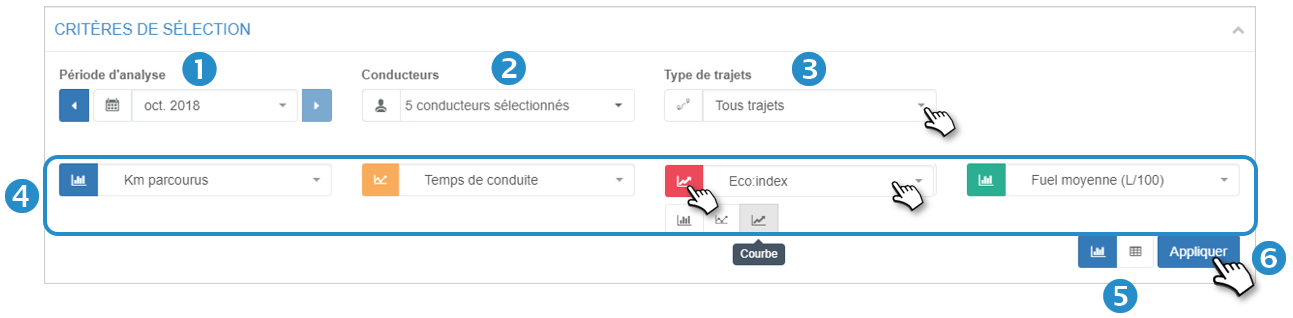
1. Select the analysis period.
2. Select the desired driver(s).
3. Select the type of trip.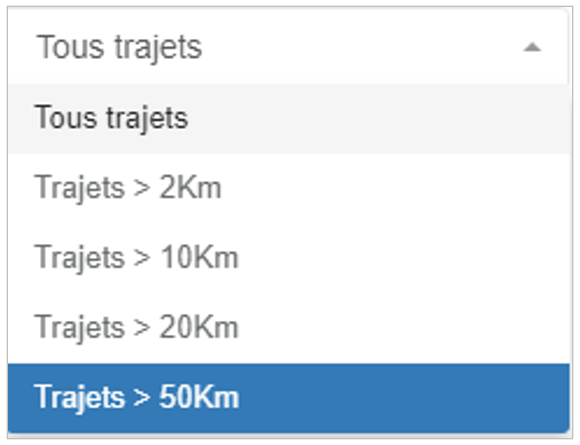
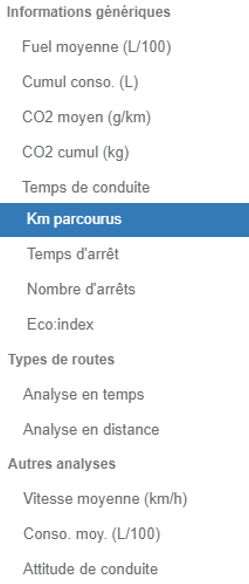
4. Select from 1 to 4 analysis criteria among the 14 proposed as well as the type of graph desired (bar, curve with mark, curve).
5. Select the type of display: chart or table.
Chart view:
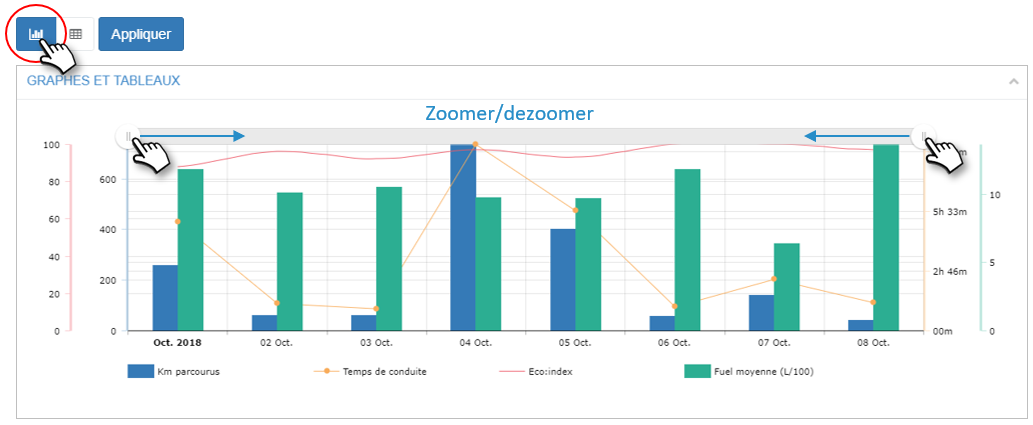
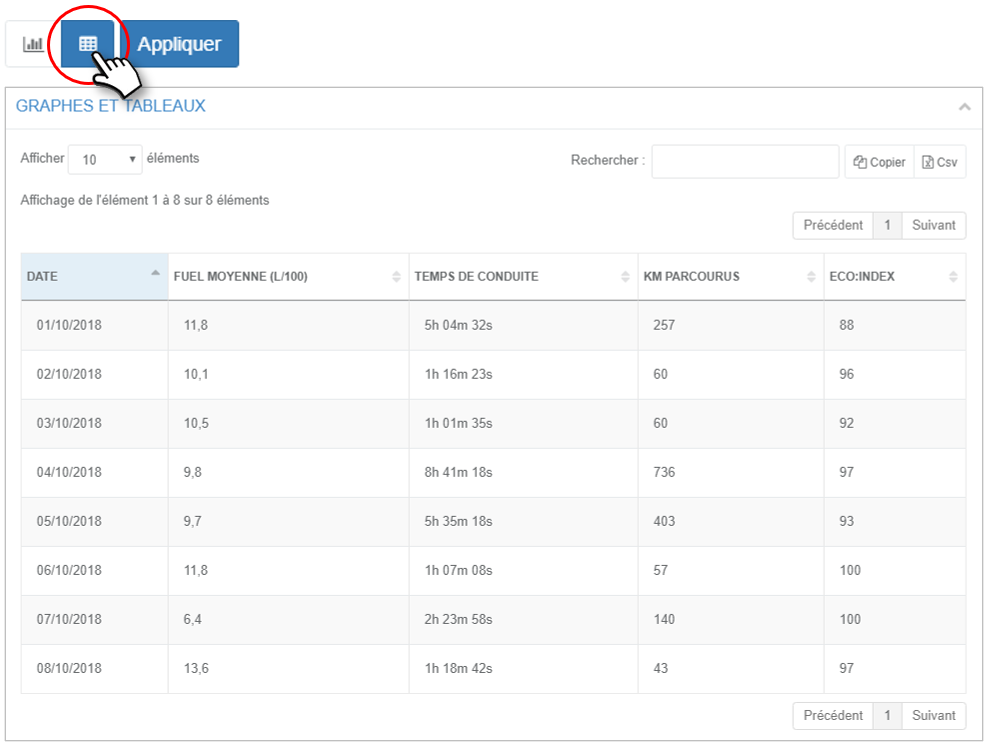
Table view:
6. Click on APPLY to display the result (see next page).
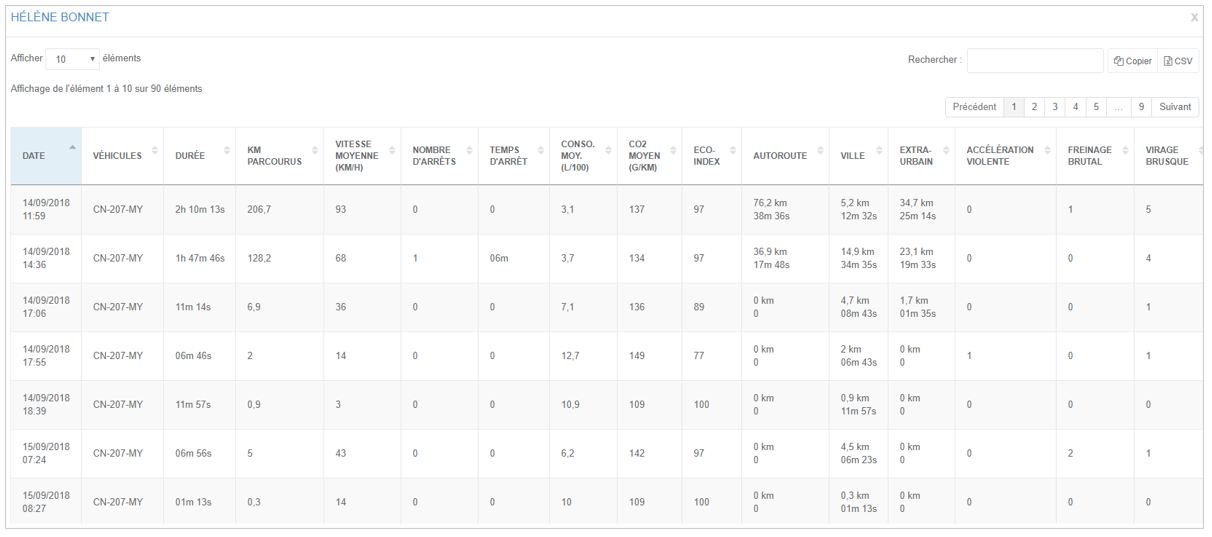
Event details
View a driver’s trip details and driving data
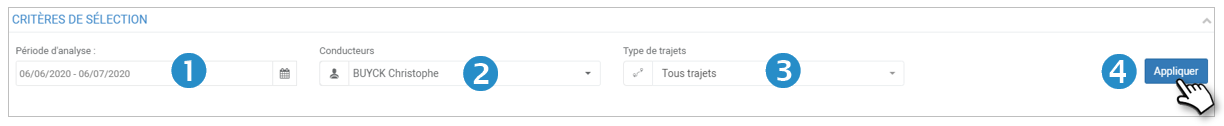
1. Select the analysis period
2. Select the driver
3. Select the type of trips
4. Click on APPLY, the results will be displayed on the screen
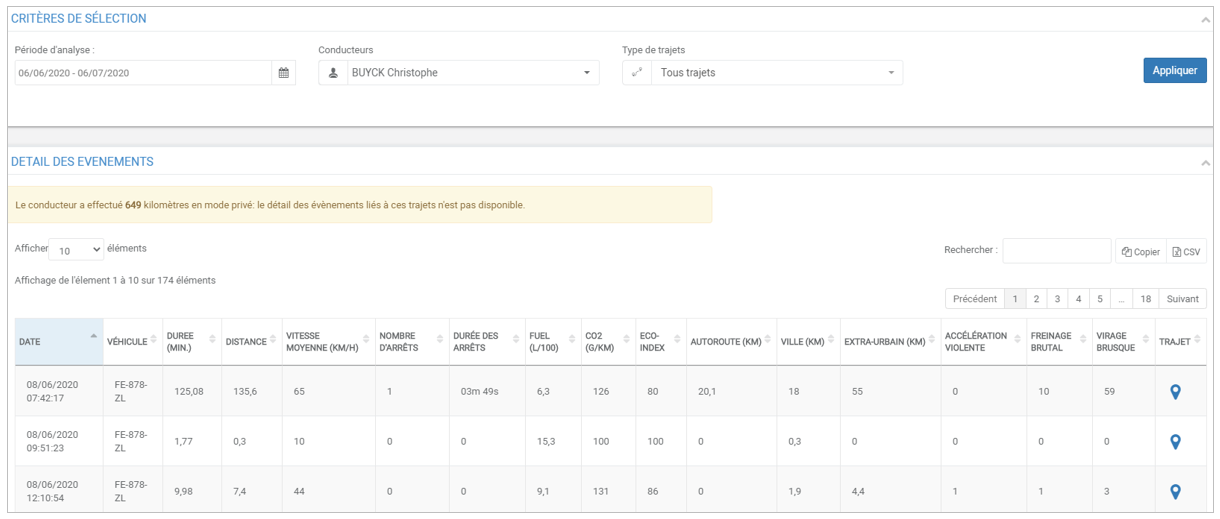
Informations
You can click on the arrows of a column to sort the content in ascending/descending order
You can copy the content of the table to paste it in another document or export it in .csv format
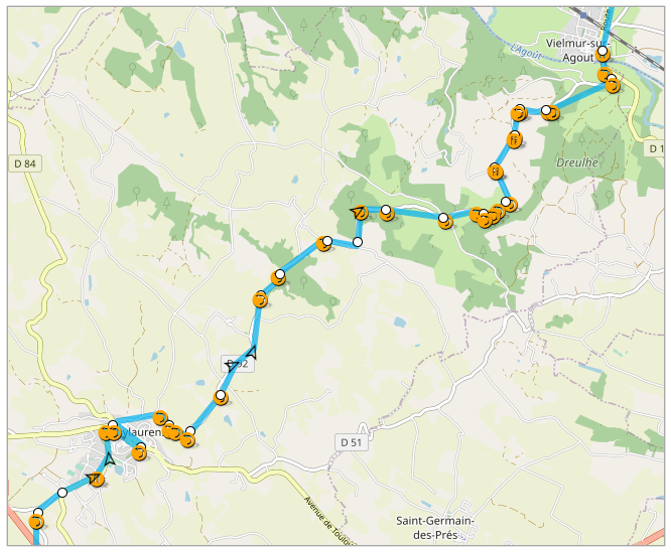
Click on  to see the routes and events (braking, acceleration, turns) on the map:
Analytical editions
Analysis of the trips of several drivers (multi-selection) and their driving data to (detail of the trips of a driver)
1. Click on the pictogram  at the beginning of the line to display the details of the trips:
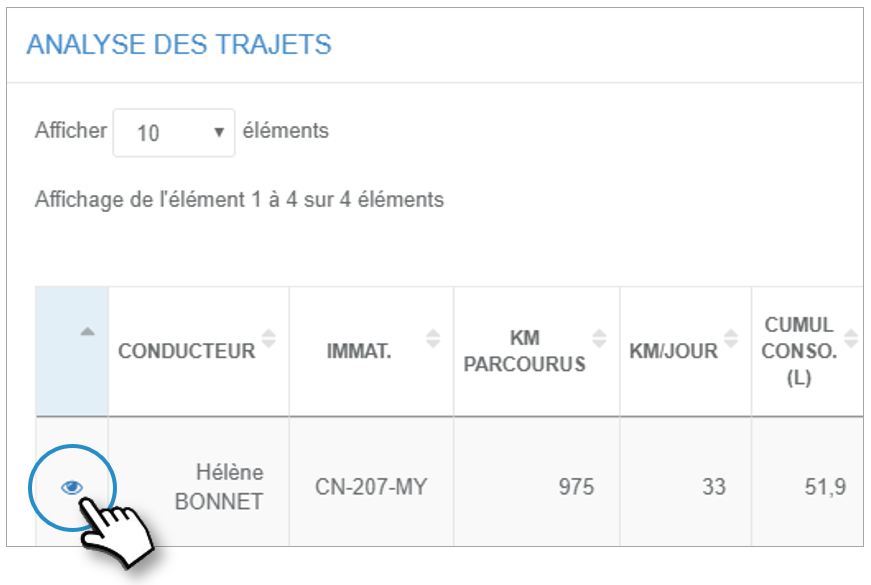
2. The details of the trips are displayed in a window